Sometimes we need to draw a dynamic chart, which its value is continuously changing. Such a chart may represent a physical parameter, like the temperature of a tank, or the speed of a motor. Or it may show the price of a stock in stock market. Many sources provide Intraday and even tick data for free on the net. Google Finance, Yahoo Finance, NetFonds, Stooq, Dukascopy, and Finam are just a few to name.
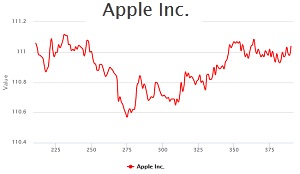
The following dynamic chart shows the tick data of several stocks, read from Google Finance, or Yahoo Finance.
In charts like this one, you may need to read tick data from a server other than the one hosting your website. If you have not heard about Same Origin Policy before, let’s see how Wikipedia describes it:
The same-origin policy is an important concept in the web application security model. Under the policy, a web browser permits scripts contained in a first web page to access data in a second web page, but only if both web pages have the same origin. An origin is defined as a combination of URI scheme, hostname, and port number. This policy prevents a malicious script on one page from obtaining access to sensitive data on another web page through that page’s Document Object Model.
It simply means that if you try to use Ajax to read from a URL, from a different origin, your browser refuses to get the data, sent from that URL. There exists various hacks for making cross-domain requests, but such hacks are compromising the security, so they are not recommended. If the server you are trying to read data from supports Cross Origin Resource Sharing (CORS), there are ways to send an Ajax request to that server and read the data. But some of such servers do not support CORS.
So the best way to read data from such servers, is to let your server to get the data from other servers and forward their response to your browser. In this method, your browser deals only with one origin, so the Same Origin Policy does not block the data.
If you want to use this method, just make sure the server which hosts your website, allows you to read remote URLs. If you can modify php.ini file, you should set “allow_url_fopen” to on. There are alternative methods for this, like changing that setting in .htaccess file, or using cURL, which are out of this article’s scope.
In PHP the most straightforward way is to use the function of file_get_contents() to read a URL and return the result in a string.
How to Use AJAX to Call a Function in WordPress
As the article, titled with AJAX in Plugins explains, if you want it to fire on the front-end for both visitors and logged-in users, you can do this:
add_action( 'wp_ajax_my_action', 'my_action_callback' );
add_action( 'wp_ajax_nopriv_my_action', 'my_action_callback'  );
Note: Unlike on the admin side, the ajaxurl javascript global does not get automatically defined for you, unless you have BuddyPress or another Ajax-reliant plugin installed. So instead of relying on a global javascript variable, declare a javascript namespace object with its own property, ajaxurl. You might also use wp_localize_script() to make the URL available to your script, and generate it using this expression: admin_url( ‘admin-ajax.php’ )
If ajaxurl is not defined on the front-end, you can add the following to the header file:
  <script type="text/javascript">
  var ajaxurl =  "<?php echo admin_url('admin-ajax.php'); ?>";
  </script>
To make AJAX calls work in WordPress, I added the following code to the functions.php of the child theme of this website:
  if ( is_admin() ) {
  add_action(  'wp_ajax_my_frontend_action', 'my_frontend_action_callback' );
  add_action(  'wp_ajax_nopriv_my_frontend_action', 'my_frontend_action_callback' );
}
function my_frontend_action_callback() {
  global $wpdb; //  this is how you get access to the database
  $source =  $_POST['source'];
  $stock =  $_POST['stock'];
  if ($source ===  "google") {
    if (ini_get('allow_url_fopen')) {
      $var = file_get_contents('http://www.google.com/finance/getprices?q='  . $stock . '&x=NASD&i=20&p=1d&f=c');
      echo $var;
    }
  } else if ($source  === "yahoo") {
    $var =  file_get_contents('http://chartapi.finance.yahoo.com/instrument/1.0/' . $stock  . '/chartdata;type=quote;range=1d/csv');
    echo $var;
  }
  wp_die(); // this is  required to terminate immediately and return a proper response
}
Finally, using our plugin, named Blazing Charts, I added the following shortcode to this post:
(left-bracket)BlazingChart charttype="highcharts" source="name-of-chart-snippet"(right bracket)
The first parameter specifies which charting library is used. The second parameter is the slug of a Custom Post Type, named Chart Snippets, introduced by that plugin.
The source of the script for the drawing is added as plain text to a Chart Snippet. The content of the chart snippet for the above chart is as following:
<div class="data-source">
    <label for="select-source">Choose An Source for the Data</label>
    <select id="select-source">
        <option value="google">Google Finance</option>
        <option value="yahoo">Yahoo Finance</option>
    </select>
</div>
<div class="stocks">
    <label for="select-stock">Choose A Stock</label>
    <select id="select-stock">
        <option value="AAPL">Apple Inc.</option>
        <option value="GOOG">Google</option>
        <option value="INTC">Intel Corporation</option>
        <option value="MSFT">Microsoft</option>
        <option value="YHOO">Yahoo! Inc.</option>
    </select>
</div>
<div id="lcontainer" style="min-width: 310px; height: 400px; margin: 0 auto"></div>
<style>
    input, label {
        display:block;
    }
    .data-source, .stocks {
        float: left;
        padding: 20px;
    }
</style>

<script type="text/javascript">
window.onload = function() {
    var chartTimer = null;
    // the following function updates the chart according to the selected source and stock
    var chartTicker = function() {
        var $dataSource = jQuery("#select-source option:selected").val();
        if ( $dataSource === false || $dataSource === "") {
            $dataSource = "google";
        }
        var stockSymbol = jQuery("#select-stock option:selected").val();
        if ( stockSymbol === false || stockSymbol === "") {
            stockSymbol = "AAPL";
        }
        var data2 = {
            'action': 'my_frontend_action',
            'source': $dataSource,
            'stock': stockSymbol
        };
        jQuery.ajax({
            type: "POST",
            url: ajaxurl,
            data: data2,
            success: function(d) {
                var data1 = [];
                var prices = d.split("\n");
                if ( $dataSource === "yahoo" ) {
                    prices.splice(0, 17);
                    i = prices.length - 181;
                    if (i < 0) i = 0;
                    for (; i < prices.length - 1; i++) {
                        var x= prices[i].split(",");
                        data1.push({
                            x: i,
                            y: parseFloat(x[1])
                        });
                    }
                } else {
                    prices.splice(0, 7);
                    i = prices.length - 181;
                    if (i < 0) i = 0;
                    for (; i < prices.length - 1; i++) {
                        data1.push({
                            x: i,
                            y: parseFloat(prices[i])
                        });
                    }
                }
                var chart = jQuery('#lcontainer').highcharts();
                var stockText = jQuery("#select-stock option:selected").text();
                chart.series[0].setData(data1);
                chart.setTitle({text: stockText});
                chart.legend.allItems[0].update({name: stockText});
            },
            async: true
        });
    };

    // if selected source or selected stock changes, timer should be killed and the chart should be drawn again
    jQuery( "#select-stock" ).change(function() {
    console.log(chartTimer);
        window.clearInterval(chartTimer);
        chartTicker();
        chartTimer = setInterval(chartTicker, 20000);
    });
    jQuery( "#select-source" ).change(function() {
    console.log(chartTimer);
        window.clearInterval(chartTimer);
        chartTicker();
        chartTimer = setInterval(chartTicker, 20000);
    });


    Highcharts.setOptions({
        global: {
            useUTC: false
        }
    });
    var data1 = [];
    var $dataSource = jQuery("#select-source option:selected").val();
    if ( $dataSource === false || $dataSource === "") {
        $dataSource = "google";
    }
    var stockSymbol = jQuery("#select-stock option:selected").val();
    var stockText = jQuery("#select-stock option:selected").text();
    if ( stockSymbol === false || stockSymbol === "") {
        stockSymbol = "AAPL";
    }
    var data2 = {
        'action': 'my_frontend_action',
        'source': $dataSource,
        'stock': stockSymbol
    };
    // first read tick data for the first time
    jQuery.ajax({
        type: "POST",
        url: ajaxurl,
        data: data2,
        success: function(d) {
            var prices = d.split("\n");
            prices.splice(0, 7);
            i = prices.length - 181;
            if (i < 0) i = 0;
            for (; i < prices.length - 1; i++) {
                data1.push({
                    x: i,
                    y: parseFloat(prices[i])
                });
            }
        },
        async: false
    });

    jQuery('#lcontainer').highcharts({
        chart: {
            type: 'spline',
            animation: Highcharts.svg, // don't animate in old IE
            marginRight: 10,
            events: {
                load: function() {
                    // set up the updating of the chart each 20 seconds
                    chartTimer = setInterval(chartTicker, 20000);
                }
            }
        },
        title: {
            text: stockText
        },
        xAxis: {
            type: 'linear'
        },
        yAxis: {
            title: {
                text: 'Value'
            }
        },
        tooltip: {
            formatter: function() {
                return '<b>' + this.series.name + '</b><br/>' +
                    this.x + '<br/>$' +
                    Highcharts.numberFormat(this.y, 2);
            }
        },
        exporting: {
            enabled: true
        },
        series: [{
            name: stockText,
            color: '#ff0000',
            data: data1
        }]
    });

}
</script>