Sometimes we need to draw a dynamic chart, which its value is continuously changing. Such a chart may represent a physical parameter, like the temperature of a tank, or the speed of a motor. Or it may show the price of a stock in stock market. Many sources provide Intraday and even tick data for free on the net. Google Finance, Yahoo Finance, NetFonds, Stooq, Dukascopy, and Finam are just a few to name.
The following dynamic chart shows the tick data of several stocks, read from Google Finance, or Yahoo Finance. Continue reading Using Highcharts.js to Draw a Dynamic Chart
Tag: HighCharts
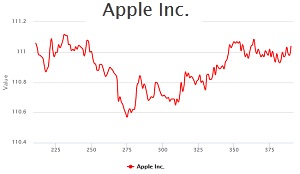
Line Chart By Using HighCharts Charting Library
The following Line chart, drawn by HighCharts.js library, is just a very basic example of what this library can do.
Continue reading Line Chart By Using HighCharts Charting Library